
colorful data
I'm Paul Blickle, infographics editor and data visualiser.
On this website I offer you a small collection of projects that I enjoyed working on.
I'm Paul Blickle, infographics editor and data visualiser.
On this website I offer you a small collection of projects that I enjoyed working on.
Since 2011 I'm employed as infographics editor and member of Team Interactive at ZEIT ONLINE. In this time I contributed to hundreds of stories. Most projects are team efforts.
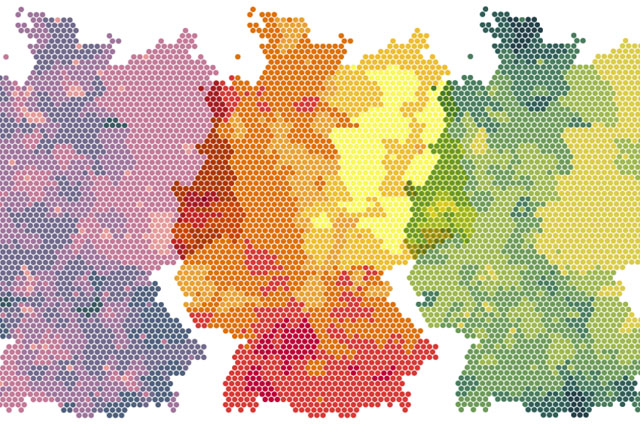
In the early euphoria following the fall of the Berlin Wall in 1989, Germany moved quickly to erase the scars of its Cold War division. But East Germany’s legacy remains visible in statistics.
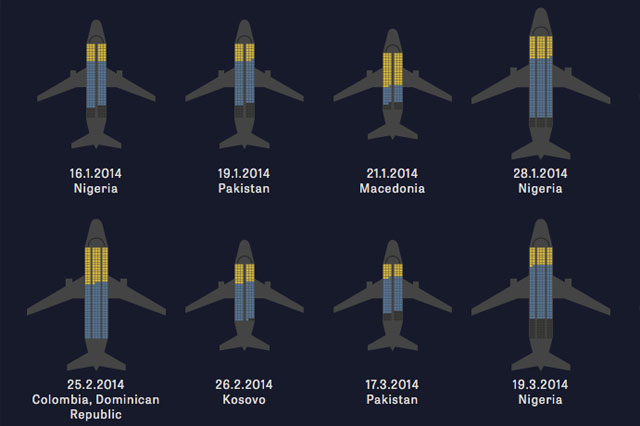
Every year, thousands of people are forced to fly out of Europe against their will. These interactive graphic shows who is in the airplanes and what the flights cost.
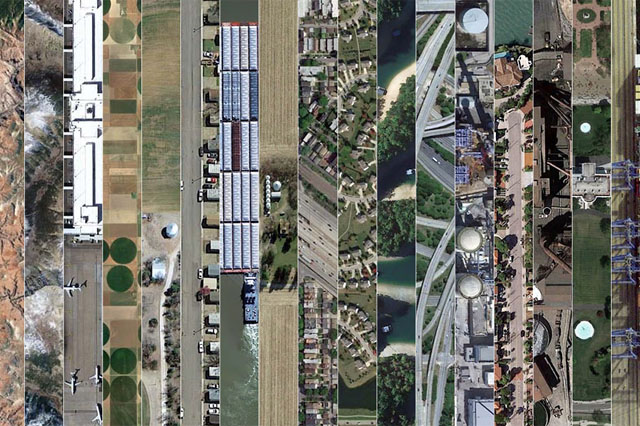
Racial conflicts, the love for guns, the mega riches: why are americans like that? Data, maps and satellite imagery show us a fascinating and disturbing nation.
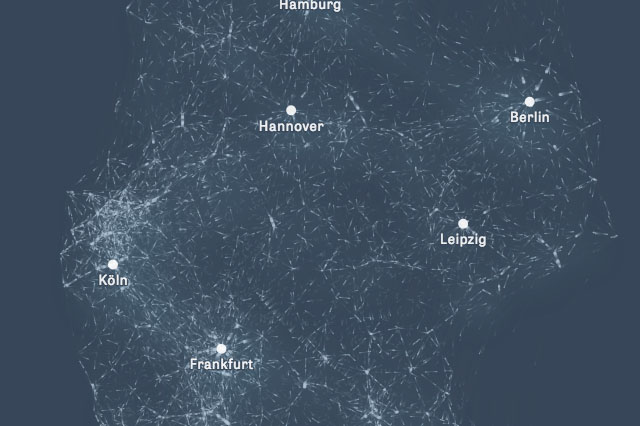
Millons are stuck in traffic for hours on their daily way to work, in overcrowded trains or on their bicycles. These graphics show how Germany commutes.
– more projects to follow here –
From 2009 until 2011 I was employed at Golden Section Graphics (now Infographics Group) as infographics editor and art director.
– more projects to follow here –
Before that, I graduated in Multimedia at University of Applied Sciences Augsburg.
– more projects to follow here –
Tools I use a lot include Illustrator, Photoshop, AfterEffects, HTML/CSS/JavaScript, QGIS, Mapbox Studio, spreadsheets software of any kind.